Blog, cliamte change, coast, coastal flooding, science, sea level, sea level rise, storm surge

New paper: Act now and we can save 3.5 m of sea level rise by the year 2300.

If we act now and cut carbon emissions, we will save up to 40 cm of sea level rise by 2100, but up to 3.5 m by 2300. That is the conclusion of our new study which developed a new approach to predicting future changes in temperature and sea level rise over the next three centuries. It’s not easy to think 300 hundred years ahead. And yet we must remember our actions today, will impact our great, great, great, great, ….., great grandchildren.


The Paris Agreement

The 2015 Paris Agreement to strengthen the global response to the threat of climate change committed the 175 countries that ratified the treaty to aim to hold ‘the increase in the global average temperature to well below 2°C above pre-industrial levels and to pursue efforts to limit the temperature increase to 1.5°C above pre-industrial levels recognizing that this would significantly reduce the risks and impacts of climate change’. However, while reducing human emissions of greenhouse gases will stabilise temperature, it is often forgotten that sea-level rise will continue for many centuries irrespectively. This is because it takes many hundreds of years for the cryosphere (the area of our planet covered by ice) and the deepest parts of the ocean to adjust to increased air temperatures. This brings long-term challenges to those living in the coastal zone. These challenges may be immense unless we take action today to mitigate for climate change and where possible, appropriately adapt.


WASP model

Most projections of climate change stop at the year 2100, for two good reasons: (1) it is hard to think and plan beyond this time-frame; and (2) global climate models are computationally expensive to run. To make it easier to investigate changes in temperature and sea-level rise beyond 2100 we developed a simple but clever global climate model that we call WASP. This stands for the Warming Acidification and Sea-level Projector. It represents the whole earth using 8 boxes (Figure 1) that capture the interaction between the atmosphere, vegetation, soil and the different layers of the ocean. Using WASP, we can accurately predict future changes in climate, for different carbon emissions, on a global scale. Because of the simple way we represent the earth, we can relatively quickly run the model out to the year 2300, many millions of times; something that is simply not possible using regular climate models. WASP is so efficient that you can run it on a smart phone in seconds (give it a go – click here).


Figure 1: The WASP modelling framework.


To avoid the most dangerous consequences of anthropogenic climate change, the Paris Agreement provides a clear and agreed target of stabilizing global surface temperatures to under 2.0 °C and preferably closer to 1.5 °C. However, policy makers do not currently know exactly what carbon emissions pathways to follow to stabilize warming below these agreed targets, because there is large uncertainty in future temperature rise for any given pathway. This large uncertainty makes it difficult for a cautious policy maker to avoid either: (1) allowing warming to exceed the agreed target; or (2) cutting global emissions more than is required to satisfy the agreed target, and their associated societal costs. We therefore, develop a new approach to restrict future warming to policy-driven targets. These uses what we call ‘Adjusting Mitigation Pathways’, in which future emissions reductions are not fully determined now but respond to future surface warming each decade in a self-adjusting manner.


Sea level rise predictions

Using our self-Adjustment Mitigation Pathways, we ran the WASP model to the year 2300, comparing climate stabilization targets ranging from 1.5 to 4.5°C with a high emissions scenario assuming no climate change mitigation. For our scenario, in which global surface temperatures were limited to 1.5°C we predicted an average sea-level rise of 40 cm above present levels by 2100 and 1 m by 2300. For the 2.0°C we predicted an average sea-level rise of about 50 cm above present levels by 2100 and around 1.30 m by 2300. In comparison, for the high emission scenario, where carbon emissions continue as normal and temperatures each 9.5°C in 2300, we predicted an average sea-level rise of 80 cm above present levels by 2100 and 4.5 m by 2300. We show therefore, that if we can meet the Paris Agreement, we can save up to 40 cm by 2100, but around 3.5 m by 2300. The latter is a big difference and will affect millions of people and important ecosystems world-wide.


Figure 2: Our sea level projections.


How will this impact people?

We have investigated the impact this has on the area of land that would be inundated by the year 2300 and the number of people that will likely be exposed, in another study. We estimate that if we restricted warming to 1.5°C, 1.5% of the global population will be exposed to sea-level rise by 2300. In contrast, for the high emission scenario, more than 5% of people on the earth will be exposed to coastal flooding. If flood defences are not taken into account, the area of land that may be inundated due to sea-level rise in 2300 will almost double for the aggressive mitigation and the non-mitigation scenario, respectively.


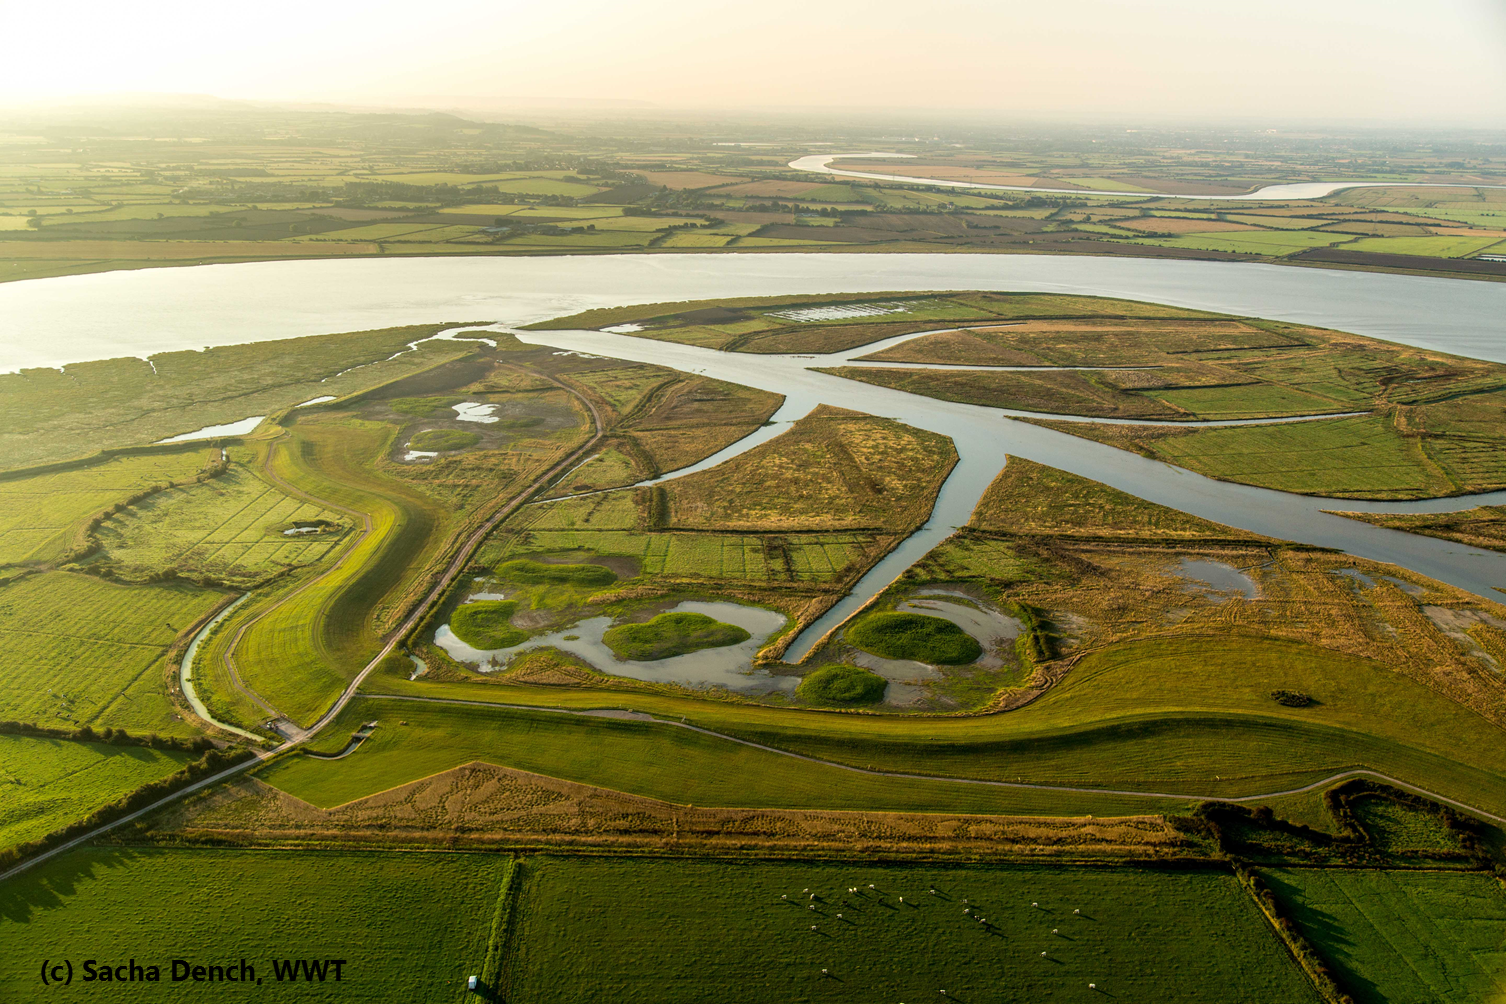
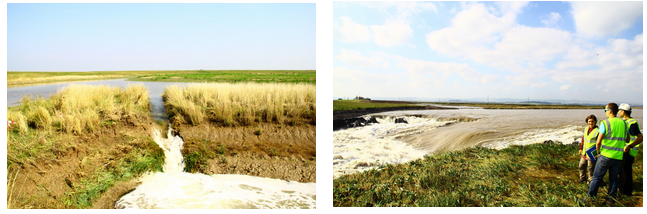
We find in another study that many highly populated low-lying delta areas could be totally flooded unless adaptation is considered and sediments are allowed to settle on adjacent land during times when rivers flood. However, adaptation has to be undertaken wisely, as decisions we make today may have long-term consequences. For example, many of the millions of people living in delta regions world-wide rely on regulated water supply or electricity via dams up-river. Dams not only control water, but also hold-back sediment from moving downstream. When rivers periodically flood, it means there is less sediment to deposit on the adjacent land. In coastal regions, this potentially means that the land will subside relative to the river and become more flood prone. Further defences, such as dikes may be required, but this exacerbates the problem. Without sedimentation, deltas areas are at high risk from sea-level rise. Subsequently deltas and other vulnerable coastal regions need to look to the future and consider plausible long-term international strategies protect millions of people against flood risk. This will not be easy as national and international collaboration may is needed, so that adaptation to sea-level rise is integrated into existing policies and development.


Conclusion

Sea-level rise poses an international threat, not just to coastal communities, but those inland who rely on the coast for livelihoods. Mitigating for climate change will reduce the rate of sea-level rise, but it will continue to rise for centuries. This is inevitable and must be something we plan for.


Authors

Ivan Haigh  – University of Southampton

Sally Brown – University of Southampton

Blog, coast, coastal flooding, tides

After the supermoon, comes the supertide

The Conversation

This article was originally published on The Conversation. Read the original article.

Ivan Haigh, University of Southampton and Kevin Horsburgh, National Oceanography Centre

The city of Plymouth, on England’s south coast, normally has fairly moderate tides. However this week it will have a 6m “supertide” – the highest tide in 18 years. This comes just days after the celebrated “supermoon”.

In fact, many locations along the UK, US and Australian coasts will experience their highest tides for tens of years around September 29 or 30. Coastal roads in Miami, for instance, have already been closed in anticipation of exceptional tides.

These high tides may bring water levels uncomfortably close to the tops of harbour walks and flood defences, emphasising the threat of rising sea levels. In the UK they are unlikely to be a major problem on their own unless they coincide with storms (a strong storm surge has a greater impact than even the most exotic of tides). However in other areas, like in parts of America and the Pacific, no storms are necessary: these high tides on their own can lead to nuisance flooding.

Why do we expect such extreme tides?

Tides are controlled by changes in the position and alignment of the moon and sun relative to Earth. Every fortnight – at new moon or full moon – the Earth, sun and moon are in an approximately straight line as seen from space and the additional gravitational pull of the sun causes stronger tides, known as spring tides.

The Bay of Fundy on Canada’s Atlantic coast has the world’s highest tides.

Yet each month one set of spring tides is higher than the other. This is because tidal forces are strengthened when the moon is at “perigee” and its elliptical orbit takes it closest to Earth. Tide-generating forces are also enhanced when the moon is directly overhead at the equator, part of a cycle lasting 27.2 days – a so-called “draconic month”.

Elliptical orbits of: (A) the moon around the Earth; and (B) the Earth around the sun.
Author provided

Tides can differ over the course of a year, as the Earth moves from its closest (perihelion) to furthest (aphelion) point from the sun and back. More important is the variation in the sun’s position north or south of the equator, which causes the seasons. The tide-generating forces are greatest at the equinoxes in March and September when the sun is directly overhead at the equator. Spring tides are always higher at these times of year.

A perfect tide?

Over periods longer than a year, very large spring tides occur when all the astronomical factors we have mentioned earlier coincide.

Two longer-term motions of the moon’s orbit around the Earth are important. These motions (astronomers call them precessions) are the reason we are seeing unusually large spring tides this year.

The first precession is known as the cycle of lunar perigee, and influences tides about every four to five years. The elliptical orbit of the moon around the Earth slowly moves in relation to the sun, completing a full circuit every 8.8 years. This means at either the March or September equinox approximately every 4.5 years the moon is both at its closest point to the Earth, and is also overhead at the equator.

The second precession is known as the lunar nodal cycle and is due to a very slow change in the moon’s orbit. Imagine the Earth’s orbit around the sun took place on an enormous sheet of glass – what astronomers call the ecliptic plane. The moon’s orbit cuts this surface at an angle of approximately 5 degrees. Over 18.6 years the moon’s orbit slowly rotates around so it cuts through the ecliptic plane in a different place.

One effect of this is to change how far above or below the equator the moon can reach in its orbit. In 2015 the moon is at the point where it deviates the least from the equator. This slightly increases the chances of the moon being directly overhead at the equator at any given point, and thus coinciding with the other factors that contribute to extreme tidal forces.

A lot of things have to fall in place at once to generate record-breaking tides and this year the cycle of lunar perigee and the lunar nodal cycle nearly perfectly coincide, resulting in some of the highest spring tides for decades.


The authors help run the SurgeWatch website and would welcome any photos of high tides during this period.

Ivan Haigh, Lecturer in Coastal Oceanography, University of Southampton and Kevin Horsburgh, Head of Marine Physics and Ocean Climate, National Oceanography Centre

Blog, coast, coastal flooding, science, sea level, storm surge, tides

Fieldwork at the Steart managed realignment scheme, Somerset, September 2014

My new PhD student Clementine Chirol has recently been undertaking field work at the Steart peninsula Managed Realignment Scheme.

Steart

The Steart peninsula is the largest managed realignment scheme undertaken in the UK, with 400 hectares of new habitats created to compensate for the losses related to coastal squeeze. To that end, flood defences are moved further inland and previously reclaimed farmlands are opened up to tidal inundation. As saltmarshes naturally attenuate wave and tide energy, the new flood defences will be more durable.

The project was designed and modelled by CH2M Hill on behalf of the Environment Agency; the construction phase was carried out by Team Van Oord. The completed site is now managed by the Wildfowl and Wetlands Trust (Tim McGrath).

The flood defences were breached on 1st September 2014 by Team Van Oord. With the increasing spring tide, the site’s channel was first flooded to full bank on the 7th. The highest spring tide was reached on 10th September (Hinkley Point: 7.05 m).

steart peninsula breach

The aim of Clementine’s PhD is to monitor the morphological evolution of the entry channel and creek network over several years as the site transitions to a more natural shape. Results from this project should help improve the design of future realignment schemes.

This early fieldwork campaign undertaken around the time of the first inundation focused on the creek system: in fact, due to the rapid erosion and turbulent flow, no deployment could be made in the breach area. We had two objectives: firstly, to perform a baseline survey of one of the creeks’ morphology and sedimentology that would help quantify all future changes. Secondly, to observe the early effects of the tide on the morphology and sediment strength at the Steart managed realignment site.

TGPS survey o this end a GPS survey of one of the creeks’ outline was realised, as well as several cross-sections along the length of the creek. Stakes in the ground were used to evaluate the accumulation or erosion of sediment at the banks. Sediment samples and syringe cores were taken to assess the bulk density and the organic matter concentration. The cohesive strength of the sediment was measured every day along the creek with a CSM (Cohesive Strength Meter) during the time of the fieldwork. The successive inundations of the site were monitored by two Gopro cameras covering the studied creek and the entry channel.

This fieldwork was a great opportunity to witness the realisation of an ambitious realignment project. It will also provide a valuable baseline to monitor the evolution of this area.

Blog, coast, coastal flooding, extreme events, flooding, science, sea level, storm surge

New paper just published – Variability in coastal flood risk

We have just had a new paper (Assessing the variability in extreme high water levels for coastal flood risk assessment) published in the Journal of Geophysical Research-Oceans – see here.

The probability of extreme storm-tide events has been extensively studied, however the variability within the duration of such events, and implications to flood risk, is less well understood. This research quantifies such variability during extreme storm-tide events (the combined elevation of the tide, surge, and their interactions) at 44 national tide gauges around the UK. Extreme storm-tide events were sampled from water level measurements taken every 15 minutes between 1993 and 2012. At each site, the variability in elevation at each time step, relative to a given event peak, was quantified. The magnitude of this time-series variability was influenced both by gauge location (and hence the tidal, and non-tidal residual characteristics) and the time relative to high water. The potential influence of this variability on coastal inundation was assessed across all UK gauge sites, followed by a detailed case study of Portsmouth. A two-dimensional hydrodynamic model of the Portsmouth region was used to demonstrate that given a current 1 in 200 year storm-tide event, the predicted number of buildings inundated differed by more than 30% when contrasting simulations forced with the upper and lower bounds of the observed time-series variability. The results indicate that variability in the time-series of the storm-tide event can have considerable influence upon overflow volumes, hence with implications for coastal flood risk assessments. Therefore, further evaluating and representing this uncertainty in future flood risk assessments is vital, while the envelopes of variability defined in this research provides a valuable tool for coastal flood modellers.


MATLAB Handle Graphics


Blog, coast, coastal flooding, energy, flooding, Journal paper, science, sea level, waves

New paper just published in Coral Reefs – Influence of the Great Barrier Reef on wave attenuation

We have just had a new paper (The large-scale influence of the Great Barrier Reef matrix on wave attenuation) published in the journal Coral Reefs. Click here to see a copy. This was our press release:

New research has found that the Great Barrier Reef, as a whole, is a remarkably effective wave absorber, despite large gaps between the reefs. This means that landward of the reefs, waves are mostly related to local winds rather than offshore wave conditions. 

As waves break and reduce in height over reefs, this drives currents that are very important for the transport of nutrients and larvae. This reduction in wave height also has implications for shoreline stability. Transition 

The Great Barrier Reef in Australia is the largest coral reef system in the world, extending 2,300 km alongshore. The reef matrix is a porous structure consisting of thousands of individual reefs, with gaps in between. The porosity varies in that is it much lower in the north where the continental shelf is narrow and there is extensive reef flats; and is greater in the south where the shelf reaches up to 300 km wide and there are extensive lagoons. 

Previously, there have been several studies investigating how individual reefs in the Great Barrier Reef influence ocean waves. However, this was the first, comprehensive, large-scale study of the influence of an entire offshore reef system on ocean wave transmission. The researchers used a 16-year record of satellite altimeter measurements of wave heights. 

The team was led by Dr Shari Gallop, Research Fellow in Geology and Geophysics at the University of Southampton, and included Dr Ivan Haigh, also from the University of Southampton; Professor Ian Young, Vice-Chancellor of the Australian National University (ANU); Professor Roshanka Ranasinghe, Professor of Climate Change Impacts and Coastal Risk (UNESCO-IHE, Deltares, ANU), and Dr Tom Durrant (Bureau of Meteorology, Australia). 

The aim was to see how wave height reduction is influenced by the porosity of the reef matrix, sea level and wind speed. Dr Gallop says: “There was no evidence that in less porous areas wave heights are lessened. This is because individual reefs, like islands, cast a ‘wave shadow’ over a large area, so that a matrix of individual reefs is remarkably efficient at reducing waves.” 

Dr Haigh adds: “As sea level varies, due to tides and storm surges, the submergence of the reef in water also varies. Wave heights are not strongly affected by water level over the reef matrix.” 

Professor Young says: “A number of previous studies have investigated the attenuation (height reduction) of ocean waves as they spread across individual coral reefs. This research is unique as it looks at the impact of a large scale reef matrix, such as the Great Barrier Reef, on wave height. Such studies are important in providing wave climate information for physical, biological and planning processes in such areas.” 

This new research, published in Coral Reefs, has important implications for wave modelling near reef systems. This is because models that consider individual reefs only may underestimate the wave reduction potential of a full reef matrix. 

Professor Ranasinghe comments: “Plans are under-way to investigate the wave attenuation characteristics over the reef in more detail, using sophisticated numerical modelling. It is of critical importance to know the potential impacts of climate change effects, such as sea level rise and variations in wave conditions, on wave attenuation and current circulation on the Great Barrier Reef. This will aid in the sustainable management of this natural wonder and the surrounding marine national park.”


Australia, Blog, coastal flooding, Journal paper, science, sea level, storm surge

New paper just published – land sinks around parts of Australia with passage of tropical cyclones.

We have just had a new paper (‘Non-linear motions of Australian geodetic stations induced by non-tidal ocean loading and the passage of tropical cyclones’) published in the journal of Journal of Geodesy – see here.

In this paper we examined movements in land around Australia using time-series from stations fitted with continuous GPS. Most people think the land is completely stable, but actually the land moves each day by a few millimetres for a variety of reasons. Here we show that land around parts of Australia sunk when cyclone Yasi crossed the Australian coast in January/February 2011. This cyclone generated a large storm surge and the extra weight of this large volume of water near the coast actually resulting in the land dropping slightly.

A earlier study (see here) showed the same thing happens around the North Sea coastlines when big storm surges happen there.


Australia, Blog, coast, coastal flooding, extreme events, flooding, Journal paper, science, sea level, storm surge, tides

New paper, just published: Australian Sea Levels – Trends, Regional Variability and Influencing Factors

While there has been significant progress in describing and understanding global-mean sea-level rise, the regional departures from this global-mean rise are more poorly described and understood. In this new paper, which you can view here, we present a comprehensive analysis of Australian sea-level data from the 1880s to the present, including an assessment of satellite-altimeter data since 1993.

We find that After the influence of El Niño Southern Oscillation is removed and allowing for the impact of Glacial Isostatic Adjustment and atmospheric pressure effects, Australian mean sea-level trends are close to global-mean trends from 1966 to 2010, including an increase in the rate of rise in the early 1990s. Given that past changes in Australian sea level are similar to global-mean changes over the last 45 years, it is likely that future changes over the 21st century will be consistent with global changes.