Here is a video of a recent seminar I gave at Bangor University:
https://bangor.cloud.panopto.eu/Panopto/Pages/Viewer.aspx?id=818fceb8-6f75-40c5-8538-a604e888ebb6

University of Southampton, National Oceanography Centre Southampton
Here is a video of a recent seminar I gave at Bangor University:
https://bangor.cloud.panopto.eu/Panopto/Pages/Viewer.aspx?id=818fceb8-6f75-40c5-8538-a604e888ebb6

![]()
This article was originally published on The Conversation. Read the original article.
Ivan Haigh, University of Southampton and Kevin Horsburgh, National Oceanography Centre
The city of Plymouth, on England’s south coast, normally has fairly moderate tides. However this week it will have a 6m “supertide” – the highest tide in 18 years. This comes just days after the celebrated “supermoon”.
In fact, many locations along the UK, US and Australian coasts will experience their highest tides for tens of years around September 29 or 30. Coastal roads in Miami, for instance, have already been closed in anticipation of exceptional tides.
These high tides may bring water levels uncomfortably close to the tops of harbour walks and flood defences, emphasising the threat of rising sea levels. In the UK they are unlikely to be a major problem on their own unless they coincide with storms (a strong storm surge has a greater impact than even the most exotic of tides). However in other areas, like in parts of America and the Pacific, no storms are necessary: these high tides on their own can lead to nuisance flooding.
Tides are controlled by changes in the position and alignment of the moon and sun relative to Earth. Every fortnight – at new moon or full moon – the Earth, sun and moon are in an approximately straight line as seen from space and the additional gravitational pull of the sun causes stronger tides, known as spring tides.
Yet each month one set of spring tides is higher than the other. This is because tidal forces are strengthened when the moon is at “perigee” and its elliptical orbit takes it closest to Earth. Tide-generating forces are also enhanced when the moon is directly overhead at the equator, part of a cycle lasting 27.2 days – a so-called “draconic month”.

Author provided
Tides can differ over the course of a year, as the Earth moves from its closest (perihelion) to furthest (aphelion) point from the sun and back. More important is the variation in the sun’s position north or south of the equator, which causes the seasons. The tide-generating forces are greatest at the equinoxes in March and September when the sun is directly overhead at the equator. Spring tides are always higher at these times of year.
Over periods longer than a year, very large spring tides occur when all the astronomical factors we have mentioned earlier coincide.
Two longer-term motions of the moon’s orbit around the Earth are important. These motions (astronomers call them precessions) are the reason we are seeing unusually large spring tides this year.
The first precession is known as the cycle of lunar perigee, and influences tides about every four to five years. The elliptical orbit of the moon around the Earth slowly moves in relation to the sun, completing a full circuit every 8.8 years. This means at either the March or September equinox approximately every 4.5 years the moon is both at its closest point to the Earth, and is also overhead at the equator.
The second precession is known as the lunar nodal cycle and is due to a very slow change in the moon’s orbit. Imagine the Earth’s orbit around the sun took place on an enormous sheet of glass – what astronomers call the ecliptic plane. The moon’s orbit cuts this surface at an angle of approximately 5 degrees. Over 18.6 years the moon’s orbit slowly rotates around so it cuts through the ecliptic plane in a different place.
One effect of this is to change how far above or below the equator the moon can reach in its orbit. In 2015 the moon is at the point where it deviates the least from the equator. This slightly increases the chances of the moon being directly overhead at the equator at any given point, and thus coinciding with the other factors that contribute to extreme tidal forces.
A lot of things have to fall in place at once to generate record-breaking tides and this year the cycle of lunar perigee and the lunar nodal cycle nearly perfectly coincide, resulting in some of the highest spring tides for decades.
The authors help run the SurgeWatch website and would welcome any photos of high tides during this period.
Ivan Haigh, Lecturer in Coastal Oceanography, University of Southampton and Kevin Horsburgh, Head of Marine Physics and Ocean Climate, National Oceanography Centre

![]()
This article was originally published on The Conversation. Read the original article.
Sally Brown, University of Southampton; Ivan Haigh, University of Southampton, and Robert Nicholls, University of Southampton
Extreme storms and rising sea levels will threaten the existence of coastal cities worldwide, unless preventative action is undertaken. With population growth and sea-level rise set to continue, research has estimated that by 2050, we can expect more than US$1 trillion worth of damages per year to be incurred by 136 of the world’s largest cities, if there is no attempt to adapt.
The game changer came in 2005, when we saw one of the most active hurricane seasons in US history. Hurricane Katrina, the fifth hurricane of that season, resulted in nearly 1,600 deaths. Almost half of these fatalities occurred in New Orleans: 80% of the city was flooded, at a cost of US$40 billion. When the water subsided, so did the population: ten years on, the city that used to house 500,000 is now home to only 300,000 people.
There are a number of ways to go about changing cities to account for rising sea levels: we can raise coastal defences, build houses on stilts, or simply move cities and their populations away from the coast. Which of these strategies works best was one of many questions set out in Climate Change: A Risk Assessment – a new report led by Sir David King and the Foreign and Commonwealth Office.
Globally, sea levels have been remarkably stable since civilisation started to develop several thousand years ago. During the 20th century, sea levels rose about 17cm, at an average rate of 1.8mm per year. Over the past few decades, that rate has doubled to more than 3mm per year. This trend is expected to continue and accelerate. According to the latest Intergovernmental Panel on Climate Change report, the sea level is projected to rise up to 1m by 2100. If the large ice sheets of Greenland and Antarctica melted, even higher rises are considered possible, albeit highly uncertain.
Importantly, if carbon emissions are stabilised, or even decrease, the sea level will continue to rise for many centuries, as the deep ocean slowly warms and the large ice sheets reach a new equilibrium. Simply put, sea-level rise is here to stay. It is likely to lead to greater flooding, salinisation (the build up of salt in surface and groundwater) and erosion in coastal areas, affecting millions of people worldwide and costing billions of dollars of damage.

EU Humanitarian Aid and Civil Protection/Flickr, CC BY-ND
The high costs of economic damage and loss of life are becoming less acceptable in a world where extreme weather events can be accurately forecast and coastal protection is possible. In many parts of the world, damages and loss of life remain high, as seen during Typhoon Haiyan, which hit the Philippines in 2013. Preparing coastal cities for extreme events and adapting them to cope with sea-level rise remains challenging: King’s report highlights the engineering, financial and socio-political limits of the adaptation challenge.
But cities are starting to embrace these challenges. For example, last year, Boston put forward the bold, novel idea of becoming an American Venice – a city full of canals to hold water as sea levels rise. New York has considered building a barrier to keep water out, in light of the fact that, with a 1m rise in the sea level, a 1-in-100 year event (that is, a severe storm one would expect to occur once every 100 years) could become 200 times more likely to occur.
London has also developed a range of flexible options that would protect the Thames Estuary against up to 5m of sea-level rise. These include raising defences, implementing flood storage and constructing a new and bigger Thames Barrier further downstream.
In developing countries, few cities are preparing for sea-level rise, despite the awareness that this is a long-term hazard. Developing cities also frequently have rapid population growth. In Shanghai and Kolkata more than 400,000 people live less than 2m above the present-day sea level. A rise of 1m will increase the frequency of a current 1-in-100 year event by 40 times in Shanghai, and about 1,000 times in Kolkata.
Local ground subsidence is another factor to worry about. This involves the sinking of the land relative to the sea due to natural and sometimes human processes (such as groundwater withdrawal). Local ground subsidence will worsen conditions in about a quarter of coastal cities – namely, those built on susceptible deltaic soils (those at the mouth of a river).

Sally Brown, Author provided
Small islands and their cities are also under serious threat from sea-level rise as they are low-lying, remote and dispersed in their territories, and often have limited financial resources. Far from being a green, spacious island, Malé – the capital of the Maldives – is one of the world’s most densely populated cities. Building protective structures is one way of reducing the impacts of extreme events: Malé is surrounded by a sea wall and giant tetrapods (a four-pronged concentrate structure about 2m high). But a lack of space limits future coastal protection.
To overcome this, a new island has been constructed, Hulhumalé, with sea-level rise also in mind. The solution to sea-level rise is simply to build upwards: The island was raised to 2m above present day sea level to protect against storms. This buys time, but moving into the late 21st or early 22nd century this may not be enough. Other Maldivian islands are following suit, with the Safer Islands programme selectively raising parts of islands. This may help the parts of the country, but clearly much more work is required to ensure the long-term prospects of this fragile island nation.
Ultimately, these case studies show us that there’s no one-size-fits-all approach to adapting cities to rising sea levels. Rather, the best bet for cities to adapt against rising sea levels is to dare to be different. Both engineering design, government authorities and social attitudes must acknowledge that change needs to occur, if we’re to avoid disaster.
Sally Brown, Research Fellow, University of Southampton; Ivan Haigh, Lecturer in Coastal Oceanography, University of Southampton, and Robert Nicholls, Professor of Coastal Engineering, University of Southampton

My new PhD student Clementine Chirol has recently been undertaking field work at the Steart peninsula Managed Realignment Scheme.
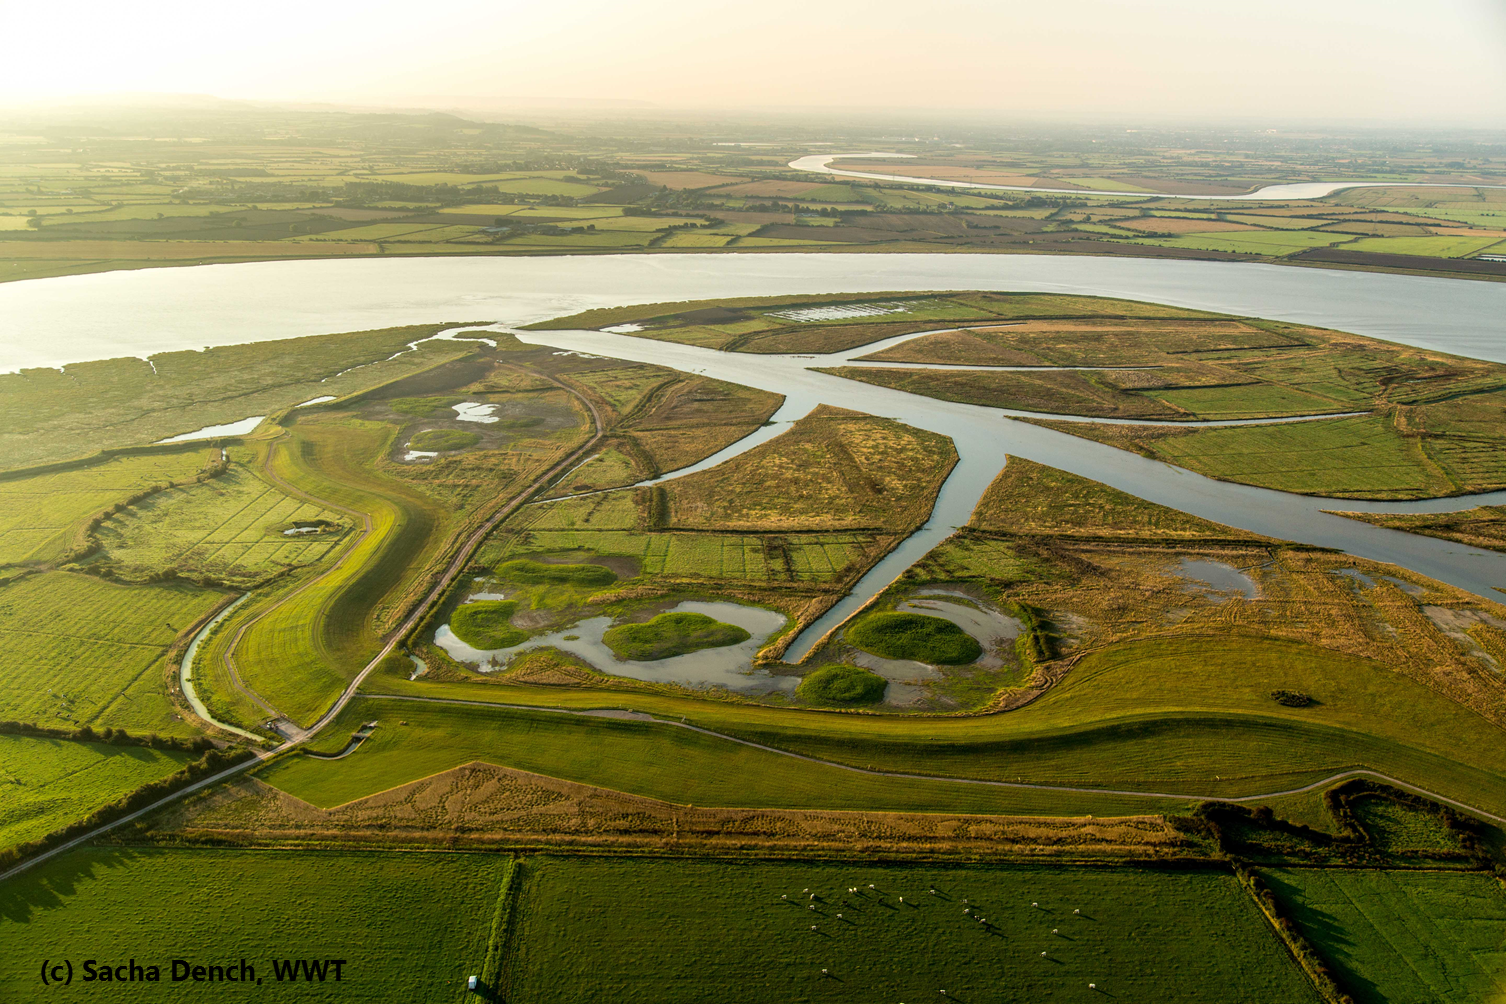
The Steart peninsula is the largest managed realignment scheme undertaken in the UK, with 400 hectares of new habitats created to compensate for the losses related to coastal squeeze. To that end, flood defences are moved further inland and previously reclaimed farmlands are opened up to tidal inundation. As saltmarshes naturally attenuate wave and tide energy, the new flood defences will be more durable.
The project was designed and modelled by CH2M Hill on behalf of the Environment Agency; the construction phase was carried out by Team Van Oord. The completed site is now managed by the Wildfowl and Wetlands Trust (Tim McGrath).
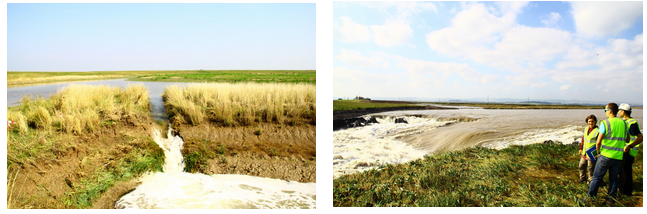
The flood defences were breached on 1st September 2014 by Team Van Oord. With the increasing spring tide, the site’s channel was first flooded to full bank on the 7th. The highest spring tide was reached on 10th September (Hinkley Point: 7.05 m).
The aim of Clementine’s PhD is to monitor the morphological evolution of the entry channel and creek network over several years as the site transitions to a more natural shape. Results from this project should help improve the design of future realignment schemes.
This early fieldwork campaign undertaken around the time of the first inundation focused on the creek system: in fact, due to the rapid erosion and turbulent flow, no deployment could be made in the breach area. We had two objectives: firstly, to perform a baseline survey of one of the creeks’ morphology and sedimentology that would help quantify all future changes. Secondly, to observe the early effects of the tide on the morphology and sediment strength at the Steart managed realignment site.
T o this end a GPS survey of one of the creeks’ outline was realised, as well as several cross-sections along the length of the creek. Stakes in the ground were used to evaluate the accumulation or erosion of sediment at the banks. Sediment samples and syringe cores were taken to assess the bulk density and the organic matter concentration. The cohesive strength of the sediment was measured every day along the creek with a CSM (Cohesive Strength Meter) during the time of the fieldwork. The successive inundations of the site were monitored by two Gopro cameras covering the studied creek and the entry channel.
This fieldwork was a great opportunity to witness the realisation of an ambitious realignment project. It will also provide a valuable baseline to monitor the evolution of this area.

We have just had a new paper (Assessing the variability in extreme high water levels for coastal flood risk assessment) published in the Journal of Geophysical Research-Oceans – see here.
The probability of extreme storm-tide events has been extensively studied, however the variability within the duration of such events, and implications to flood risk, is less well understood. This research quantifies such variability during extreme storm-tide events (the combined elevation of the tide, surge, and their interactions) at 44 national tide gauges around the UK. Extreme storm-tide events were sampled from water level measurements taken every 15 minutes between 1993 and 2012. At each site, the variability in elevation at each time step, relative to a given event peak, was quantified. The magnitude of this time-series variability was influenced both by gauge location (and hence the tidal, and non-tidal residual characteristics) and the time relative to high water. The potential influence of this variability on coastal inundation was assessed across all UK gauge sites, followed by a detailed case study of Portsmouth. A two-dimensional hydrodynamic model of the Portsmouth region was used to demonstrate that given a current 1 in 200 year storm-tide event, the predicted number of buildings inundated differed by more than 30% when contrasting simulations forced with the upper and lower bounds of the observed time-series variability. The results indicate that variability in the time-series of the storm-tide event can have considerable influence upon overflow volumes, hence with implications for coastal flood risk assessments. Therefore, further evaluating and representing this uncertainty in future flood risk assessments is vital, while the envelopes of variability defined in this research provides a valuable tool for coastal flood modellers.


We have just had a new paper (The large-scale influence of the Great Barrier Reef matrix on wave attenuation) published in the journal Coral Reefs. Click here to see a copy. This was our press release:
New research has found that the Great Barrier Reef, as a whole, is a remarkably effective wave absorber, despite large gaps between the reefs. This means that landward of the reefs, waves are mostly related to local winds rather than offshore wave conditions.
As waves break and reduce in height over reefs, this drives currents that are very important for the transport of nutrients and larvae. This reduction in wave height also has implications for shoreline stability. Transition
The Great Barrier Reef in Australia is the largest coral reef system in the world, extending 2,300 km alongshore. The reef matrix is a porous structure consisting of thousands of individual reefs, with gaps in between. The porosity varies in that is it much lower in the north where the continental shelf is narrow and there is extensive reef flats; and is greater in the south where the shelf reaches up to 300 km wide and there are extensive lagoons.
Previously, there have been several studies investigating how individual reefs in the Great Barrier Reef influence ocean waves. However, this was the first, comprehensive, large-scale study of the influence of an entire offshore reef system on ocean wave transmission. The researchers used a 16-year record of satellite altimeter measurements of wave heights.
The team was led by Dr Shari Gallop, Research Fellow in Geology and Geophysics at the University of Southampton, and included Dr Ivan Haigh, also from the University of Southampton; Professor Ian Young, Vice-Chancellor of the Australian National University (ANU); Professor Roshanka Ranasinghe, Professor of Climate Change Impacts and Coastal Risk (UNESCO-IHE, Deltares, ANU), and Dr Tom Durrant (Bureau of Meteorology, Australia).
The aim was to see how wave height reduction is influenced by the porosity of the reef matrix, sea level and wind speed. Dr Gallop says: “There was no evidence that in less porous areas wave heights are lessened. This is because individual reefs, like islands, cast a ‘wave shadow’ over a large area, so that a matrix of individual reefs is remarkably efficient at reducing waves.”
Dr Haigh adds: “As sea level varies, due to tides and storm surges, the submergence of the reef in water also varies. Wave heights are not strongly affected by water level over the reef matrix.”
Professor Young says: “A number of previous studies have investigated the attenuation (height reduction) of ocean waves as they spread across individual coral reefs. This research is unique as it looks at the impact of a large scale reef matrix, such as the Great Barrier Reef, on wave height. Such studies are important in providing wave climate information for physical, biological and planning processes in such areas.”
This new research, published in Coral Reefs, has important implications for wave modelling near reef systems. This is because models that consider individual reefs only may underestimate the wave reduction potential of a full reef matrix.
Professor Ranasinghe comments: “Plans are under-way to investigate the wave attenuation characteristics over the reef in more detail, using sophisticated numerical modelling. It is of critical importance to know the potential impacts of climate change effects, such as sea level rise and variations in wave conditions, on wave attenuation and current circulation on the Great Barrier Reef. This will aid in the sustainable management of this natural wonder and the surrounding marine national park.”

While there has been significant progress in describing and understanding global-mean sea-level rise, the regional departures from this global-mean rise are more poorly described and understood. In this new paper, which you can view here, we present a comprehensive analysis of Australian sea-level data from the 1880s to the present, including an assessment of satellite-altimeter data since 1993.
We find that After the influence of El Niño Southern Oscillation is removed and allowing for the impact of Glacial Isostatic Adjustment and atmospheric pressure effects, Australian mean sea-level trends are close to global-mean trends from 1966 to 2010, including an increase in the rate of rise in the early 1990s. Given that past changes in Australian sea level are similar to global-mean changes over the last 45 years, it is likely that future changes over the 21st century will be consistent with global changes.
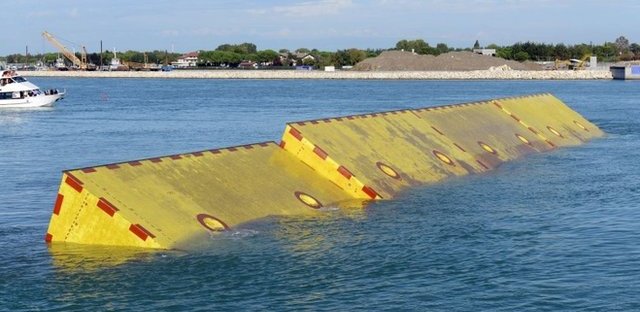
Flood barriers protecting Venice from storm surges have been tested for the first time:
http://www.bbc.co.uk/news/world-europe-24509476

Our new paper on coastal flooding has just been published online – http://link.springer.com/article/10.1007/s11069-013-0610-5.
In this paper we model the inundation of the 10th March 2008 flood event, which generated the highest water level in Southampton water since 1935. We created a regional dataset of flood extent information and used this to validate the modelling.
Check out these documentary. My research on sea level rise is featured around the 20 minute mark.
